The anticipated increase in urban population of 2.5 billion people by 2050 poses significant environmental challenges. While the various environmental impacts of urbanisation have been studied individually, integrated approaches are rare. This study introduces a spatially explicit model to assess urbanization’s effects on ecosystem services (green infrastructure availability, cooling, stormwater retention) and the environmental impact of building construction (material demand, greenhouse gas emissions, land use). Applied to the Netherlands from 2018 to 2050, our results show that integrating green infrastructure development with building construction could increase green areas by up to 5% and stabilize or increase ecosystem service provisioning. Dense building construction with green infrastructure development is generally more beneficial across the Netherlands, reducing resource use and enhancing ecosystem services. Conversely, sparse construction with green infrastructure is more advantageous for newly built areas. These findings offer insights into the environmental consequences of urbanization, guiding sustainable urban planning practices.

The United Nations projects a growth of the urban population of 2.5 billion people between 2018 and 2050, which will concurrently result in a significant expansion in urban land cover 1,2 . The transformation of natural landscapes to urban land impacts both the local and the global environment. Understanding these effects is crucial for fostering sustainable urbanization strategies in the future. At the local level, urban development results in the replacement of green infrastructure (i.e., trees, shrubs and grasses), with gray infrastructure, (i.e., roads and buildings). Green infrastructure can be defined as “a strategically planned network of natural and semi-natural areas with other environmental features designed and managed to deliver a wide range of ecosystem services” 3 . Ecosystem services are the direct and indirect contributions of ecosystems to human wellbeing 4 . These services encompass a wide array of benefits, including the provision of essential resources like food and freshwater, the regulation and preservation of the environment through functions such as managing stormwater, enhancing soil quality, reducing noise levels, and regulating air temperatures 5,6,7 . Additionally, green infrastructure provides cultural benefits, serving as spaces for recreational activities and leisure 8 . Transformation of green into gray surfaces increases urban vulnerability to health and climate-related threats such as flooding and urban heat 9,10 .
The increasing demand for new buildings and infrastructure, driven by urbanization, impacts the environment not just at the local level, but at the global level as well. In 2019, the manufacturing of building materials, such as steel and cement, accounted for 11% of energy and process-related CO2 emissions 11 . Continuous growth of the building stock could result in an increase of building material related emissions from 3.5 to 4.6 Gt CO2 eq yr −1 between 2020–2060 12 . Therefore, the consequences of urban transformation extend far beyond city boundaries, emphasizing the need for sustainable urban development practices.
A wide range of factors affect the local urban climate and resilience to climate change, with ecosystem services playing a crucial role 13,14 . The provisioning of ecosystem services depends on the type, size, and arrangement of green infrastructure, and is also influenced by the local climate, non-ecological elements, such as buildings and roads, and socioeconomic variables 6,15,16 . For instance, the services provided by the same configuration, size, and type of green infrastructure can differ when the climate and landscape changes 16 . Therefore, conducting location-specific assessments of ecosystem services in high spatial resolution is important to capture the factors that influence their provisioning within a given area.
A considerable amount of research has focused on understanding how urbanization impacts green infrastructure and the provision of ecosystem services. Some studies have explored the impact of urbanization on the expansion of urban land 2,17 or the availability of green infrastructure 18,19 . Studies have also shown the negative impact of urban growth and urban densification on biodiversity and the provisioning of ecosystem services 20,21,22 and trade-offs between spatial configuration of urbanization and ecosystem service supply 23,24 . Investigations into the implementation of green infrastructure strategies have revealed their potential to improve ecosystem service provisioning, while also highlighting the synergies and trade-offs among these services 9,25 . These studies highlight the complex interplay of factors shaping urban environments and the critical role of green infrastructure in fostering sustainable cities.
Urban planning choices also affect the impact related to building construction. Dense building construction reduces material use and greenhouse gas emissions compared to sparsely constructed areas 26 . Dense urban regions often prioritize multi-family housing, which typically consist of smaller dwelling units and are therefore more resource-efficient compared to single-family houses. Dense building construction is also associated with more efficient energy usage during building operation 27 . On the other hand, building densification often result in higher material turnover due to building replacements 26 and, in the case of high-rise construction, buildings also tend to be more material-intensive due to the need for additional structural components 28 . Therefore, the location and characteristics of buildings play a critical role in shaping the global environmental impacts.
In addition to spatial planning choices, circular economy strategies in the building sector are critical for reducing environmental impacts. These strategies encompass a variety of practices, including building lifetime extension, the use of alternative construction materials, such as biobased or lightweight material, alternative energy sources, increased material efficiency, designing for reusability and recyclability, minimizing dwelling floor space, and enhancing recycling processes 12,26,29 . Implementing these strategies can lead to a halving in the material related GHG-emissions compared to a Baseline 12,26 . However, some strategies show trade-offs, such the substantial land-use impact associated with the construction of wooden building 26 .
Several studies on the impact of urbanization on building materials have been conducted. Historical assessments of the global level extraction of construction minerals as well as projections for the future have been published by the International Resource Panel, showing a threefold increase during 1970-2015, and an additional doubling until 2050 30 . Spatially explicit studies show more detail: high-resolution building maps enable the assessment of materials incorporated within them, offering insights into opportunities for sustainable resource use 26,31 . Historical building stock maps have been employed to scrutinize urban growth patterns and associated material stock dynamics over time 32,33,34,35 . Maps of the existing building stock also serve as a foundation for modeling future dynamics to identify more sustainable solutions for building construction 26,29 .
While existing studies provide valuable insights into specific sustainability aspects of urban development, an integrated approach that provides insights into both the local and the global impacts of urbanization is still lacking. This is crucial because urban development impacts both green and gray infrastructure; analyzing these impacts together provides an opportunity to reduce the impact related to construction of buildings, while simultaneously reducing losses or improving availability of ecosystem services. To bridge this gap, this paper aims to address the following question: How can green and gray infrastructure planning be optimized for sustainable urban development? We take the Netherlands as a case-study, a country notable for its high population density and unique environmental challenges. While focused on the Netherlands, we provide insights and approaches that are transferable to other urban environments to enhance their understanding and implementation of sustainable urban development approaches. Addressing this question is important in light of international urbanization trends anticipated towards 2050 1,36 , which have resulted in several initiatives and policies. These include the European Urban Initiative, which focuses on creating innovative solutions to urban sustainability 37 ; the European Nature Restoration Law, targeting no net loss of green spaces and aiming for their increase by 2050 38 ; and the ambition of the European Green Deal towards achieving net-zero emissions by the same year 39 . Our research also aligns global commitments, such as the United Nations’ goals for sustainable urban futures, highlighting the broader relevance of our work 1 . The Dutch commitment to achieving circularity and climate neutrality by 2050 exemplifies these broader efforts 40 .
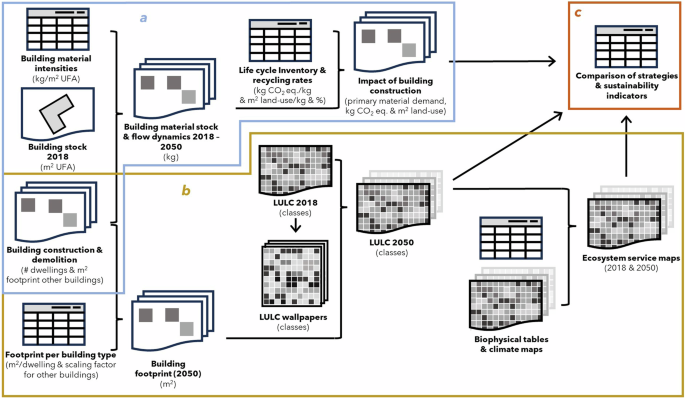
Figure 1 presents the methodolgical framework. Our analysis begins with spatially explicit strategies for building construction and demolition from 2018 to 2050, as outlined by the Dutch Environmental Assessment Agency 41 . These strategies are based on regional population growth projections and preferred locations for building construction. We focus primarily on two contrasting approaches: the Dense strategy, which concentrates construction within present urban areas, and the Sparse strategy, which promotes development in low-density areas such as agricultural and industrial sites (Table 1). Our analysis examines the implications of these strategies on the building material impact, land-use change and ecosystem service provision. Firstly, we analyze the effects of urbanization on the non-local aspects: the demand for primary building materials, the greenhouse gas emissions, and the embodied land use associated with the extraction and production of construction materials (Fig. 1a). Our approach incorporates three construction methods: conventional, circular, and biobased. These methods are applied within the frameworks of the Dense and Sparse urbanization strategies. Secondly, we assess how these urbanization strategies affect local land use change and its impacts on local ecosystem service supply (Fig. 1b): local green infrastructure availability, air temperature regulation, and stormwater retention capacity (Table 2). These services are critical for enhancing urban quality of life and improving resilience against environmental and socio-economic challenges 42 . In our land-use and ecosystem service analysis, we integrate the Dense and Sparse strategies with two distinct land-use approaches: Green, emphasizing extensive greening around buildings, and Gray, characterized by minimal green infrastructure development. In the final step, we identify the most effective combination of building and land-use strategies for each sustainability indicator, highlighting key synergies and trade-offs (Fig. 1c). Spanning the period from 2018 to 2050, and building upon the work of van Oorschot et al. (2023) 26 , our research integrates a diverse array of sustainability indicators in support of sustainable urban development. In the tables below (Tables 1 and 2), urbanization strategies, land-use approaches and construction material choices are summarized, as well as the sustainability indicators on which these are assessed.
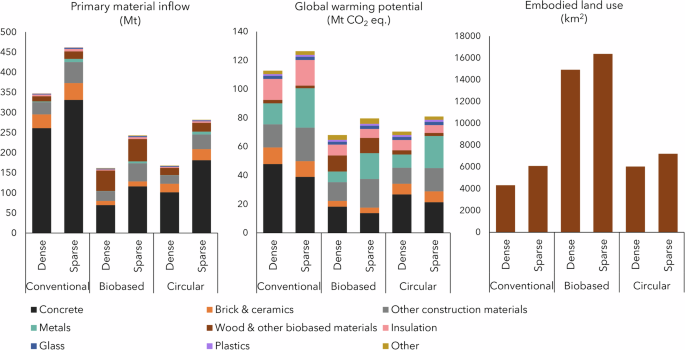
The global warming potential associated with building materials totals between 68 and 127 megaton (Mt) CO2-equivalent in the period 2018-2050, dependent on the urbanization strategy and choice of building materials. Annually, this can be translated into an average of 2-4 Mt/year, relatively low compared to the impact related to space heating, which encompassed 24.7 Mt CO2-equivalent in 2018 alone 43 . However, as buildings are expected to greatly reduce operational energy due to the energy transition, addressing emissions from materials becomes increasingly important. Biobased construction stands out with the lowest demand for primary materials and the lowest embodied greenhouse gas emissions, largely as a result of replacing concrete structures with wooden ones. However, biobased construction exhibits a notably high embodied land use impact related to wood production, reaching over 16000 km 2 for strategy Sparse and Biobased, equivalent to 40% of the Netherlands’ surface area. This embodied land use significantly exceeds that of conventional buildings and circular building strategies, which range between 4000 and 7000 km 2 . Overall, the circular construction appears to be the most favorable choice, resulting in lower primary material use as well as lower CO2-emissions, without the trade-off to embodied land use.
From a building material perspective, prioritizing denser building practices over sparse ones is the more sustainable choice (Fig. 2). While densification leads to increased building replacements, consequently raising the demand for materials, the structures created in denser environments are generally smaller, favoring multi-family dwellings over single-family houses. Together with the greater potential for secondary material use, this results in a reduced environmental impact compared to sparse building construction. The results do not change between strategy Green and Gray, because the surrounding area of the building has no effect on the material related impacts (Table 3).
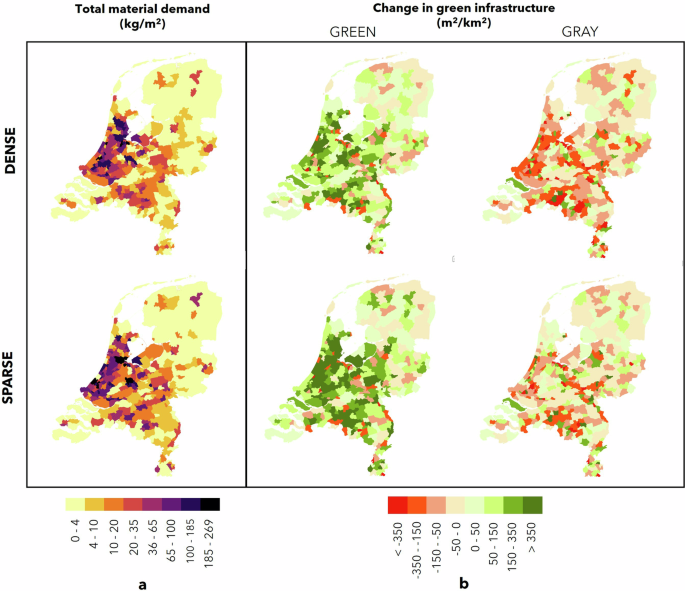
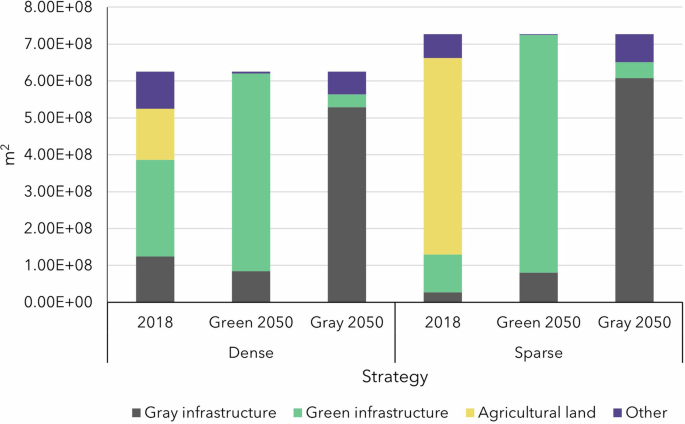
Our findings show that buildings present a relatively small portion of the total transformed land area and therefore highlight the potential for concurrent growth in green infrastructure alongside the expansion of building area for strategy Green (Fig. 4). Among the strategies considered, the Sparse-Green combination emerges as the most effective in expanding the area of green infrastructure, with an increase of 5% compared to 2018 (3% for Dense-Green). The higher value for Sparse stems from a lower building density, resulting in a larger area of transformed land (Fig. 3b). In the absence of green infrastructure integration (strategy Gray), green infrastructure declines by 2% in strategy Dense and by almost 1% in strategy Sparse. However, the Sparse approach significantly reduces agricultural land, creating a trade-off between urban development and agricultural areas.
In both Dense and Sparse strategies construction predominantly occurs in the central-West of the Netherlands, which seems to correlate with the largest changes in green infrastructure area (Fig. 3b). Nonetheless, variations in the spatial patterns of material demand and land use and land cover (LULC) change are visible as well. This is because changes in green infrastructure are influenced not only by the total area being transformed, but also by the original LULC. For example, municipalities where a relatively small area of largely gray infrastructure is transformed into a combination of gray and green infrastructure may show a larger increase in green infrastructure than municipalities where a large area of predominantly green areas are transformed into a mix of green and gray infrastructure. Similarly, while most municipalities experience a decline in green infrastructure in the Gray strategy, some municipalities still show an increase in green infrastructure due to the transformation of non-residential areas like agricultural or industrial land into built-up areas with a small amount of green infrastructure. The maps reveal a trade-off between material impacts and green infrastructure availability: while the Sparse-Green strategy leads to more substantial increases in green infrastructure, the Dense strategy is more advantageous in terms of building material requirements.
A lack of green infrastructure integration in building construction is associated with a reduction in ecosystem service supply. For Gray strategies, newly constructed areas experience more than a 5% decline in the availability of green infrastructure (within a 1 km 2 area around dwellings) and stormwater retention capacity, with air temperature increasing slightly over 1%, compared to the average of 2018. For green infrastructure availability, the impact is most pronounced in the Sparse building strategy, where the dominance of gray infrastructure and agricultural land leads to a substantial 42% decrease. Both Dense-Gray and Sparse-Gray show reductions in stormwater retention capacity of almost 50%. In contrast, when evaluating the total building stock (i.e., existing plus newly constructed buildings), the decreases are generally less severe, under 5% for most services except for green infrastructure availability, which show a 7% and 5% reduction in strategy Dense and Sparse, respectively. Conversely, the integration of green infrastructure with building construction leads to a net increase or stabilization of ecosystem service supply when compared to 2018 (Table 3). For the entire building stock, the changes are smaller than 5% for air temperature and stormwater retention, but exceed the 5% for green infrastructure availability, indicating a significant impact.
Compared to the average of 2018, strategy Sparse-Green leads to a significant almost 60% increase in green infrastructure availability, for newly constructed areas. Strategy Dense-Green shows a lower, yet substantial, improvement of nearly 40% compared to the 2018 average. When considering the entire building stock projected for 2050, the Sparse-Green approach still leads with a roughly 10% increase in green infrastructure, closely followed by the Dense-Green strategy at 8%. In absolute terms, the Green strategies reveal a rise from an average of 0.303 km 2 (within a 1 km 2 around dwellings) in 2018 to between 0.328 km 2 and 0.332 km2.
The choice of the most effective urbanization strategy for urban cooling varies depending on the scale of analysis. Focusing on newly constructed areas between 2018 and 2050, the Sparse-Green approach is the preferred strategy. This method slightly reduces air temperature by 0.4%, corresponding to 0.12 o C on hot summer days, while the Dense-Green strategy results in a small increase of 0.5%. The rise in temperature for Dense-Green can be attributed to the partial replacement of urban green infrastructure with gray infrastructure. In contrast, the Sparse-Green strategy converts a significant portion of agricultural land into green infrastructure, leading to an overall decrease in temperature. The results change when analyzing the entire building stock. In this broader context, the Dense strategy emerges as more effective, showing a marginal decrease in air temperature by 0.01%. This greater efficiency is because the Dense-Green strategy introduces green infrastructure in areas where temperatures are relatively high, thereby having a more substantial effect in cooling than the Sparse-Green strategy. It is important to highlight that these temperature changes are marginal, a point that will be expanded upon in the discussion section.
In the context of stormwater retention, our analysis reveals that dense urban construction, when integrated with green infrastructure, exhibits a slightly higher retention capacity compared to sparse building constructions. The Dense-Green strategy shows more than 20% increase in stormwater retention for new constructions, compared to an slightly less than 20% increase observed under the Sparse-Green strategy. When considering the entire building stock, the Dense-Green strategy yields a 2.1% increase in stormwater retention, slightly surpassing the 1.9% increase achieved by the Sparse-Green strategy. The slightly lower improvement rates associated with the Sparse strategy can be attributed to the transformation of a considerable portion of agricultural land. This land inherently possesses effective stormwater retention capabilities, which diminishes the relative impact of the strategy. Moreover, the Dense strategy is characterized by a higher proportion of apartment constructions compared to the Sparse strategy. These building types use space more efficiently than row- or detached houses, allowing for the creation of substantial areas for green infrastructure development.
In summary, trade-offs exist in spatial planning decisions for the studied ecosystem services, and these trade-offs can vary depending on the scope of analysis. Overall, strategy Dense-Green is potentially the best choice as it strategically integrates green infrastructure in high-demand areas, ultimately benefiting a larger population.
Figure 5 shows how the change in LULC, green infrastructure availability, air temperature, and stormwater retention capacity between 2018 to 2050 work out at the local level, showing an example in the area of Leiden. The figure highlights differences between the strategies Dense-Green and Sparse-Green. In strategy Dense, the primary focus is on the conversion of built-up urban areas within the city of Leiden. In contrast, strategy Sparse primarily targets the transformation of agricultural land on the outskirts of Leiden.
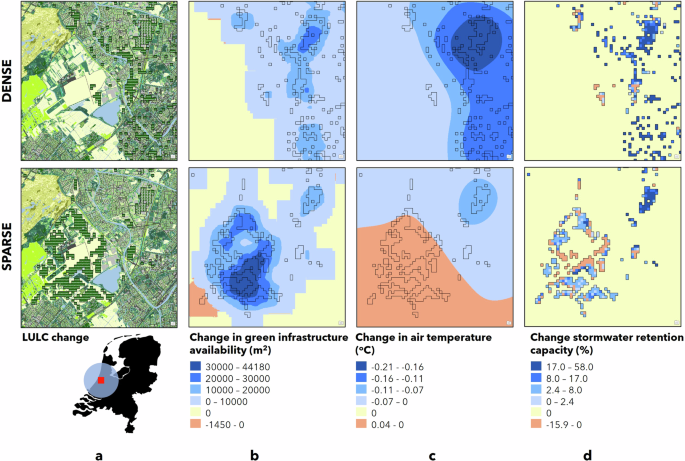
Both strategies demonstrate substantial increases in green infrastructure availability (Fig. 5b), with a more pronounced increase in strategy Sparse, due to the conversion of mainly agricultural land into partially green infrastructure. Within the Dense strategy, some construction activities are undertaken in areas that already have a considerable share of green, resulting in a smaller increase in green infrastructure availability compared to Sparse. In strategy Sparse, a small part in the south-west of Leiden shows a reduction in green infrastructure availability due to the transformation of green space into a partially built-up area.
In strategy Dense, the change in air temperature shows a similar pattern to that of green infrastructure availability (Fig. 5c), with the most pronounced reduction in the urbanized areas of Leiden. The largest reduction in air temperature within Leiden is observed under the Dense strategy, achieving a maximum decrease of 0.21°C. Conversely, the Sparse strategy leads to a temperature increase across a broad area, despite integrating green infrastructure into construction projects. This increase is primarily due to the conversion of cooler agricultural lands and green spaces into partial gray infrastructure. However, within the Sparse strategy, certain urbanized areas, especially those with transformed industrial zones in Leiden, do exhibit a cooling effects. These localized temperature contrast with the aggregated data for the entire Netherlands, highlighting the importance of multi-scale analysis in understanding the impacts of urban development strategies.
Furthermore, our study reveals significant variability in stormwater retention capacity across the area. To improve interpretation of the results, we aggregated the data to a resolution of 100 × 100 meters (Fig. 5d). The aggregated findings align with the overall trends observed nationwide. Under the Dense strategy, there is a clear increase in stormwater retention capacity, reaching a maximum increase of 58% compared to 2018. In strategy Sparse, the transformation of largely agricultural land and green infrastructure into partially gray infrastructure results in a reduction in stormwater retention capacity, with a maximum decrease of 15.9%.
Exploring strategies for sustainable urban development is essential to develop an urban environment that is as sustainable as possible. This study examined the impact of urbanization, emphasizing the global environmental effects of the use of building materials, and the impact on land-use change and ecosystem services locally, to understand how to optimize urban development for sustainability.
Our findings suggest that dense urban development is preferred from a building material perspective due to the construction of smaller dwelling units and higher potential for reuse and recycling. Dense urban development is also likely to be more energy-efficient, as high population densities typically correlate with lower per capita energy consumption 27 . When coupled with green infrastructure development, dense urban development can also lead to an increase in ecosystem service supply in areas where demand is high. While these arguments favor dense urban developments, green infrastructure development in densely populated areas could pose challenges due to high demand for services associated with gray infrastructure, such as housing, commercial purposes and transportation, resulting in competition for land-use. Additionally, underground infrastructure, like pipes and cables, can complicate green infrastructure implementation, particularly for trees 45 . Therefore we recognize that, in addition to green infrastructure development at ground-level, alternative ways to implement green infrastructure in urban areas, such as green roofs and facades, need to be investigated as well.
Sparse building construction has faced criticism for promoting urban sprawl, thereby diminishing natural habitats and biodiversity, and increase greenhouse-gas emissions and costs related to transportation, water and energy infrastructure 46,47 . Our analysis indicated that sparse building construction primarily results in a trade-off between agricultural land and built-up areas, while protected nature was excluded from the analysis. It must be emphasized that these conclusions are valid for the Netherlands, where natural areas are scarce, small and well protected, and non-cultured land is absent. In such a situation, sparse urban development could positively impact ecosystem service provisioning and biodiversity, when coupled with the development of green infrastructure. However, to sustain food production (another crucial ecosystem service), sparse urban development could inadvertently lead to the transformation of other areas, which may be rich in biodiversity, into agricultural land. These arguments again promote dense urban development. Clearly, there are trade-offs between dense and sparse urban developments in terms of building materials, energy use, land-use, ecosystem services, and biodiversity. Considering these trade-offs is crucial for sustainable urban development.
We assessed green infrastructure availability as the total green infrastructure within a 1 km² area around dwellings. This method differs from the conventional per capita analysis of green space availability and serves as a broad indicator of ecosystem service provision, while the per capita indicator typically focuses on recreational services 21 . Our findings revealed a significant increase in total green infrastructure availability for strategies Green, suggesting enhanced ecosystem service supply. Through translating our findings into per capita terms, we can draw comparisons with existing literature for recreational service provisioning. By 2050, a decrease in green infrastructure availability from 34 m² per capita to 20 m² per capita was observed for the Green strategies, stemming from increased population densities. These values are within the wide spectrum of green space availability in European cities, ranging from 2.5 to 200 m² per capita 48,49 . In a recent study, Liu et al. 21 reported that in the Paris region, only 48% of the 10 m² per capita policy target within a 500-meter radius is achieved, highlighting disparities with insufficient green infrastructure in densely populated regions contrasted with excess in less populated ones 21 . Our results largely align with this pattern, demonstrating low green infrastructure availability in urban areas (frequently below 1 m² per capita within a 1 km 2 area around dwellings), in contrast to areas outside urban centers, where the availability often exceeds 10 m² per capita. In some rural areas however, our results show low per capita values because of the large share of agricultural land that is not considered to be accessible green space. The large variability in GI availability, and thus the availability of ecosystem services, underscores the need for a standardized metric for green infrastructure availability to support urban sustainability.
Our strategies showed a potential increase in the stormwater retaining capacity up to 2% compared to 2018. Locally, the increase in stormwater retention can be far larger than 2%, resulting in a strongly reduced portion of stormwater that runs off the surface, along with associated nutrients and pollutants. The average of 2% is significant, given that over 600 km² of land surface area is being transformed, offering a substantial potential to reduce stormwater treatment and drainage needs. For comparison, a study on green infrastructure strategies for Amsterdam demonstrated a potential annual reduction of 1.4 million cubic meters of stormwater treatment volume, decreasing treatment costs by 1.1 million euros per year 25 . In our strategies the total area of created green infrastructure could be up to 200 times higher than in aforementioned study.
Air temperature changes were small in our results, with an average decrease of 0.02 °C across the total building stock and a local maximum reduction of 0.42 °C. These results are consistent with similar studies on greening strategies 25,50 . The small temperature impact can be attributed to the relatively small land use and land cover changes in relation to the overall land area of the Netherlands, combined with a considerable air mixing distance of 500 meters. In absolute terms, densely built areas showed temperatures up to 2 °C higher than rural areas. Recent studies show that urban heat is strongly affected by building density 20,51 , indicating a preference for low-density urban development for better temperature regulation. Nonetheless, dense urban regions, which have a greater demand for cooling, could derive more benefit from green infrastructure implementation. Our findings reveal that integrating green infrastructure with new building construction is not enough to achieve substantial cooling, suggesting that additional greening measures are required, either through the integration of green infrastructure in buildings, or through reducing building densities.
Across the assessed building strategies, the biobased strategy showed the lowest greenhouse gas (GHG) emissions. However, biobased constructions significantly impact embodied land use due to the requirements for wood cultivation. The Netherlands’ heavy reliance on wood imports raises concerns about the sustainability of biobased construction. Local upscaling of wood production is challenging as well, due to limited available land and competition with housing, agriculture, and nature conservation 52 . Mishra et al. 53 suggest that a worldwide increase in wooden buildings, up to 90% of new constructions from 2020 to 2100, is feasible if agricultural land productivity is doubled 53 . This intensification would allow more land for plantation forestry. However, achieving this requires strong global governance and careful planning. From an overall environmental impact perspective, opting for the circular building strategy results in the least trade-offs. This preference becomes more evident when extending the analysis beyond 2050, a period during which buildings constructed between 2018 and 2050 will be deconstructed. Circular designs facilitate material recycling and component reuse, making them an attractive option for the long-term sustainability of the built environment.
In the past, urbanization patterns have shown a great diversity across regions and cities 54 . With ongoing urbanization, we face an opportunity to steer urban development towards sustainability. We demonstrated how this process can be supported by quantifying the impact of urbanization strategies on various sustainability indicators. These indicators relate to decision making and planning at different levels. At the local scale, maps showing relative changes in ecosystem service supply can be used by urban planners to develop or evaluate their plans, identify trade-offs in ecosystem service provisioning, and prioritize sustainability aspects. On a larger scale, the aggregated impact results, as presented in Table 3, facilitate comparison of decision making options on different sustainability aspects. Greening strategies and strategies for building construction are typically handled by different authorities 55,56 . Our study emphasizes the need for an integrated planning approach that combines these efforts. Planning strategies at the local level also need to align with higher-level policies, for instance related to areas restricted from urbanization 57 . Climate related policies, including the environmental performance of buildings, are typically addressed at the (inter)national level 58 . At the national level, the insights from our study provide guidance for policymakers to formulate strategies to enhance the sustainability of building practices, for instance related to building locations, material use and recycling practices.
This study investigated sustainable urbanization strategies within the context of the Netherlands, yet our findings hold a broader relevance. Our findings underscore the importance of an integrated approach to urban development that emphasizes sustainability in both green and gray infrastructure. This approach aligns with sustainability goals set by international entities like the European Union and the United Nations, underscoring its relevance across different countries and policy levels 1,38,39 . The feasibility of implementing our method in other areas, especially in rapidly urbanizing regions like the Global South, is contingent upon data availability. Although urban ecosystem services in these regions have been quantified using open-source data such as remote sensing data and models such as InVEST 59,60 , data on construction materials in these regions remain scarce 61,62 . Furthermore, the high-resolution spatial data required for modeling building construction and demolition activities used in this study is probably not universally accessible. A potential solution to this is remote sensing based land-cover data, which is increasingly available in high resolution (e.g. Sentinel-2 and Landsat). This kind of data can be implemented into open-source LULC change models, such as the wallpapering method used in this study 63 , to model the dynamics of urban infrastructure over time. Although these data sources do not offer the same level of detail as those used in this study, they provide a potential foundation for analyzing sustainable urbanization strategies across diverse global contexts.
We included a wide spectrum of sustainability indicators. This scope can still be broadened to encompass additional indicators, related to building materials (e.g. eutrophication, particulate matter formation, etc.) and additional ecosystem services. For instance, soil-related services, carbon storage, noise reduction, air pollution removal, and positive health impacts present other important urban ecosystem services for which quantification approaches have been conceptualized or developed 7,64,65,66 . This would add to a more comprehensive overview of sustainability implications, but also adds to decision-making complexity. To support decision-making and address trade-offs inherent in considering a wide array of sustainability factors, multi-criteria analysis (MCA) can still be applied. MCA involves normalizing and assigning weight to various sustainability factors. These weights can be based on the perceived importance of each factor as determined by stakeholders 13 .
The interplay between building dimensioning and green infrastructure planning could be further investigated. For instance, building dimensioning has an effect on both land use composition and building materials. Several studies show higher GHG emissions associated with large and tall buildings compared to low-rise structures 28,67,68 . Building dimensioning also affects the local temperature, with taller buildings generally increasing urban heat 51 . Low-rise buildings leave less space for integration of green infrastructure in the building’s surroundings. Green infrastructure could also be integrated into the building through green roofs and facades. The interplay between building dimensioning, public and private greenery, and its relation to material consumption presents an interesting direction for future research.
To conclude, our study offers an in-depth analysis of the environmental impacts of urban development, emphasizing the integration of green and gray infrastructure and how they affect building construction related impacts and ecosystem services. Despite the projected growth of the Dutch building stock, our study illustrates the possibility of simultaneously expanding green infrastructure by up to 5%, and maintaining or improving the supply of ecosystem services compared to 2018 levels. Our findings also highlight the potential to reduce environmental impacts through the use of circular design practices. The analysis reveals trade-offs between dense and sparse urban development in terms of environmental impact and the provision of ecosystem services, underlining their importance in determining sustainable urban development strategies. We also recognize the different scales of impacts of ecosystem services and construction materials, underscoring the importance for a multi-scale analysis. Though focused on the Netherlands, our approach has broader applicability, offering a strategy to simultaneously reduce the environmental impact of urban development while improving ecosystem services provisioning.
Our study included several stages, each aimed at the optimization potential of sustainable urban development. Using a spatially explicit model, we combined scenarios for building construction and demolition with material intensities to derive material stock and flow dynamics. The model also combines the building construction and demolition data with land use and land cover (LULC) scenarios to assess changes in LULC, which formed the basis for ecosystem service analysis. With the insights gained from the model, we explored strategies to refine building construction practices, aiming to optimize material use and improve ecosystem services simultaneously. The method is explained in more detail below, and model details are available in Supplementary Methods 1.
We combined spatial modeling with material flow analysis to assess the material stock dynamics in the Dutch building sector. Material flow analysis is a widely used method to quantify material stocks and flows, their dynamics over time, and their circularity 69,70,71 . We calculated material stock and flow dynamics through translating the building maps, provided in number of dwellings constructed or demolished and footprint (m 2 ) for non-residential buildings, to useful floor area (m 2 ), specific per building typology, and multiplying these values with their respective material intensity (kg/m 2 ). We assessed GHG emissions related to material production on the basis of the life cycle inventory database EcoInvent version 3.6 72 and supplemented the dataset where needed with values from scientific literature 26 . The starting point of our analysis was spatial data of the Dutch building stock in 2018 73 and spatially explicit strategies for building construction and demolition from 2018 to 2050 41 . The strategies were constructed based on regional population growth projections and preferred locations for building construction, with a focus on two distinct strategies: Dense and Sparse. In the Dense strategy, building construction prioritizes urban areas, while the Rural strategy emphasizes construction in areas with low population densities like agricultural and industrial sites. These strategies were presented at a 100 by 100-meter resolution, quantified in terms of dwelling units constructed or demolished and square meters of non-residential building footprint.
Three building material strategies were assessed (Table 2): Conventional, which uses traditional materials such as a concrete and steel structure; Circular, employing circular design principles, such as a detachable steel frame and mechanically detachable bricks; and Biobased, using timber frame constructions, wooden facades, cross-laminated timber floors and biobased insulation and roofing. We refer to Supplementary Methods 1 for the material intensities. For each strategy, we calculated the primary material demand and embodied greenhouse-gas emissions related to the construction materials and the embodied land use related to production of wood, using the model developed by van Oorschot et al. 26 . Because land occupation (m 2 year) was significantly higher for wood than for other materials (van Oorschot et al., 26 ), we calculated the total area of land (m 2 ) required for wood production. With the model we assessed primary and secondary material use through material flow analysis and life cycle impact assessment.
Secondly, we analyzed how building construction impacts changes in LULC. We compiled a LULC map by combining a detailed land use map of the Netherlands, the Registration Large-Scale Topography 74 , with coverage maps (land cover) of trees, shrubs and grasses 75,76,77 . We did not consider agricultural land as green infrastructure due to its heterogeneous composition and, aside from food provision, limited capacity for providing ecosystem services. The resulting map presents detailed information on land use and green infrastructure coverage on a 10 by 10 m resolution. We made a distinction between 22 LULC classes (Supplementary Methods 2).
To analyze LULC changes between 2018 and 2050, we translated construction strategies into building footprints and linked them with LULC strategies using the “wallpapering model” (WP) developed by Lonsdorf and colleagues 63 . For the LULC strategies (see details below), we identified suitable compositions on the original LULC map, clipped the designated area to a rectangular “tile”, replicated the tile in a grid to create a “wallpaper” and switched the LULC within every cell that shows construction activities between 2018 and 2050. We classified building footprints into three groups based on their share within each 100 × 100 m gridcell: less than 10%, 10-40% and greater than 40%. This classification limited the number of tiles to three per LULC strategy.
Our analysis involved two LULC strategies: Green and Gray (Supplementary Methods 2). The Gray strategy is characterized by less than 5% low vegetation (grass and shrubs) per cell (100 × 100 meters) and Green, is characterized by more than 30% continuous green space consisting of grass, shrubs, and trees, of which at least 10% trees. The Green strategy is based upon the rule of thumb for having at least 30% urban forest in cities and the recommendation of the Nature Restoration Law to have at least 10% tree cover in urban environments 78,79 . We assumed that LULC transformation corresponds to the 100 × 100 m gridcell size used for building construction and demolition data. Given that building construction inherently involves alterations to the immediate surroundings, our findings provide reasonably accurate estimations. The modeling details are described in greater detail in the Supplementary Methods 2.
The LULC maps served as the basis for analyzing LULC changes in the Netherlands and the capacity of green infrastructure to deliver ecosystem services. Modeling details can be found in Supplementary Methods 3. We quantified the overall extent of green infrastructure across the Netherlands projected for 2050, along with its availability for residents. Furthermore, we evaluated the effectiveness of green infrastructure in mitigating urban heat and retaining stormwater. For the latter two, we employed the Integrated Valuation of Ecosystem Services and Tradeoffs (InVEST) model. InVEST is an open-source software developed by the Natural Capital Project and Stanford University for mapping and valuing ecosystem services 80 . InVEST combines LULC data with additional information to provide output values for ecosystem services in biophysical and/or economic units.
Green infrastructure plays a vital role in enhancing both physical and mental well-being 65,66 . The availability of green infrastructure refers to the measurement of green spaces within a specific distance, often within residential neighborhoods, primarily aimed at assessing the extent of accessible green areas 21 . Here, we calculated the total green infrastructure availability within 1 km 2 area surrounding dwellings as a broad indicator of ecosystem service provision.
Many cities experiencing heat waves are focusing on urban heat mitigation. Vegetation plays a crucial role in reducing the urban heat island (UHI) effect by offering shade, altering the city’s thermal properties, and providing cooling through evapotranspiration 81 . This has positive effects on citizens’ health, lowering mortality and morbidity rates, enhancing comfort and productivity, and reducing the need for air conditioning 82 . Here, we employed the InVEST model to calculate urban cooling. The urban cooling model calculates, among other indicators, changes in air temperature based on various factors, including shade, evapotranspiration, albedo, and proximity to cooling islands like parks. The changes in air temperature present an indication for the cooling provided by vegetation.
Climate change leads to more intense droughts and rain events 83 . Large impervious covers in urban areas increase the risks of flooding in these areas due to loss of infiltration capacity, and decrease interception and evaporation by green infrastructure 64 . The InVEST stormwater runoff retention model provides information on runoff retention. Runoff retention involves holding stormwater by permeable land to avoid polluting rivers and oceans. The model estimates surface runoff, the portion of stormwater not retained. The Stormwater Retention model focuses on services over an annual timeframe rather than individual storm events and flooding. We employed this model to calculate changes in stormwater retention capacity for the various urbanization strategies.
We assessed changes in ecosystem service capacity between 2018 and 2050 on two scale levels: firstly, for areas that are being transformed for building construction, and secondly, for the entire building stock and its surroundings (100 by 100 m grid cells). In addition to the national-scale analysis, we assessed ecosystem locally, which is crucial because the provision of the analyzed ecosystem services exhibits limited spatial reach. Locally, the impacts of LULC changes exhibit greater variability 9 . We take a 36 km 2 area in and around Leiden as a case-study area, encompassing both a densely built urban area and some of its surrounding area which is characterized largely by agricultural land.
The data that supports the findings of this study are available in the supplementary information of this article, with exception of the spatial building and construction scenario data, which is only available from the authors upon request and with permission of the data owners (The Dutch Environmental Assessment Agency).